
Landing Page A/B Testing That Connects Variants to Ad Spend (Not Just Click-Through)

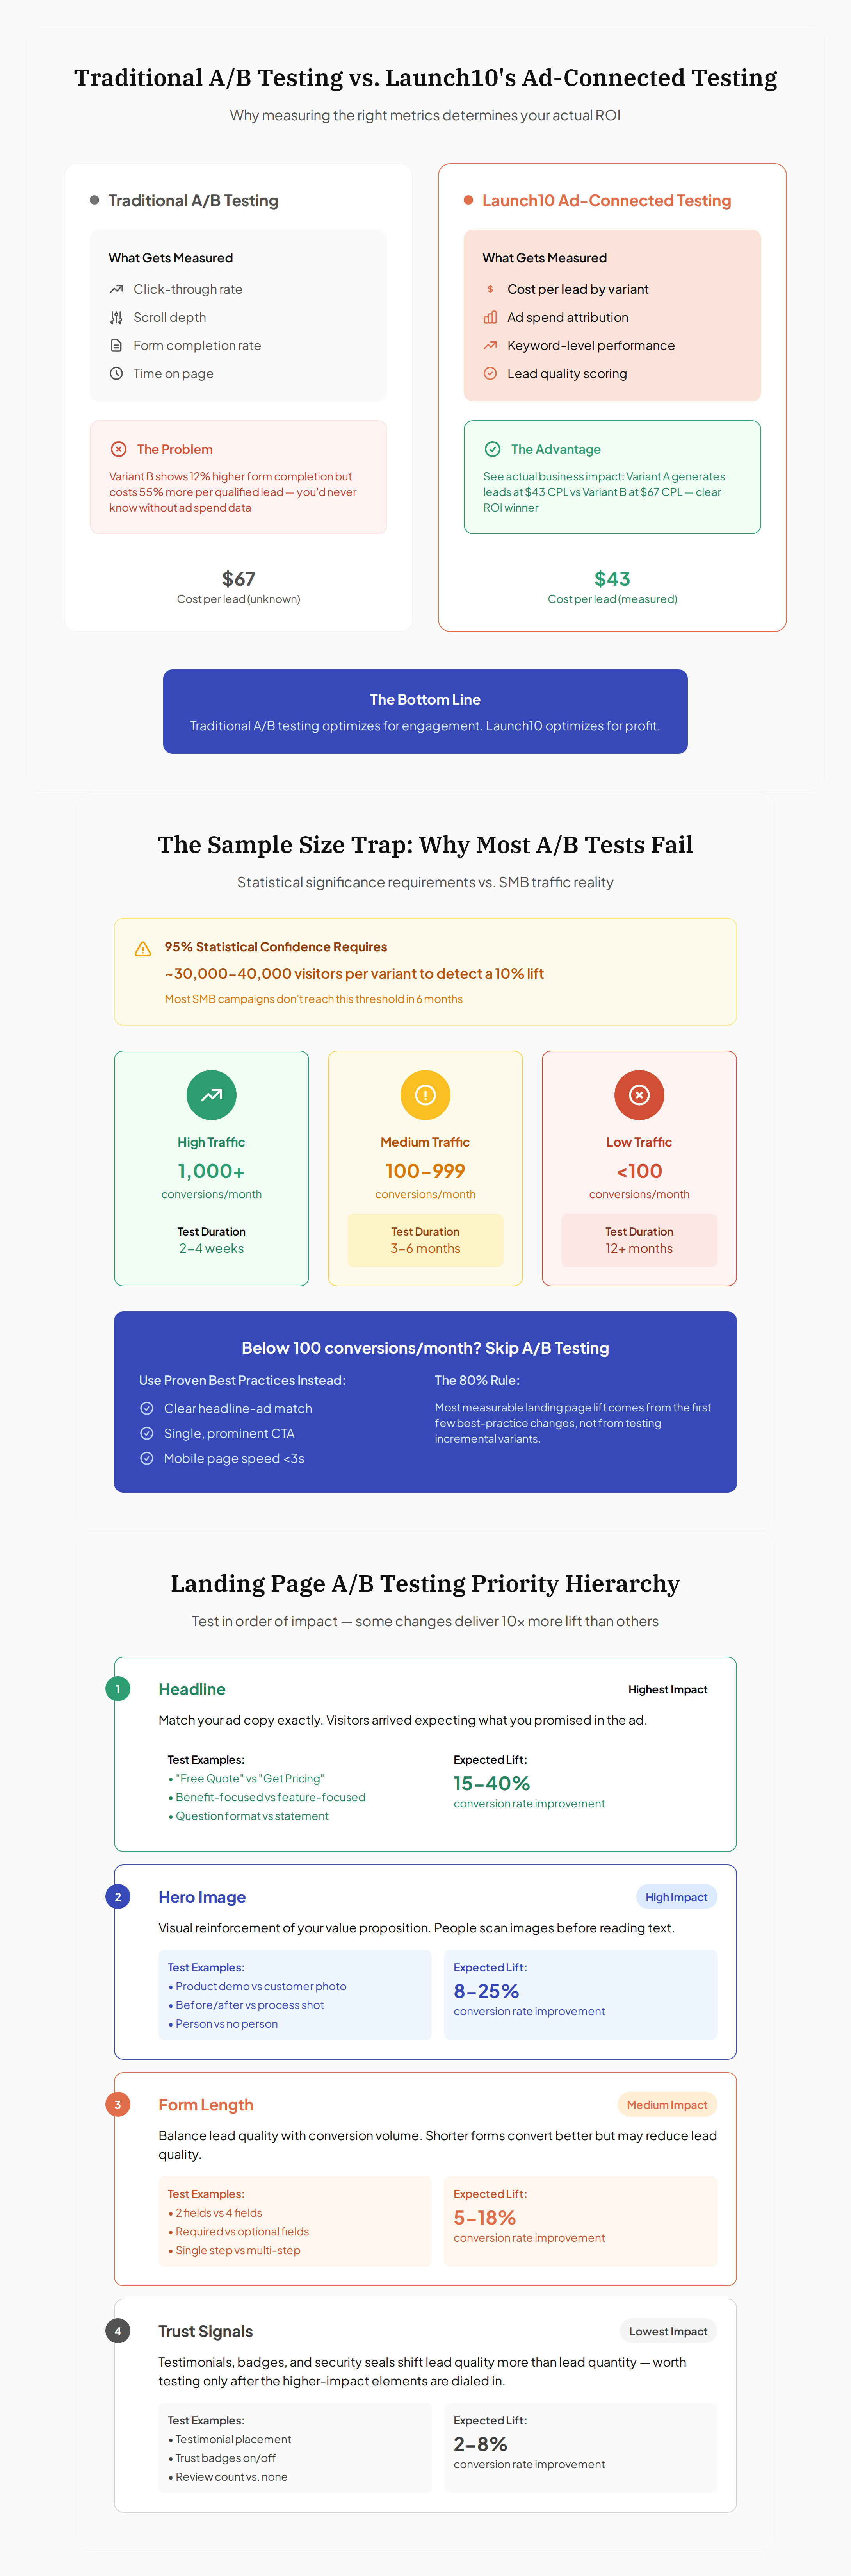
Most landing page A/B testing gets it backwards. Teams obsess over which variant gets more clicks, higher scroll depth, or better form completion rates — but the metric that actually matters, cost per lead, gets ignored completely. Variant B might “win” with a 12% higher form completion rate, but if those leads cost $67 each compared to Variant A’s $43 cost per lead, you just optimized your way into higher acquisition costs.
The problem isn’t the testing methodology — it’s that most A/B testing platforms measure page engagement without connecting back to the Google Ads spend that drove the traffic in the first place. Effective landing page A/B testing requires tracking each variant’s performance all the way back to ad spend: which Google Ads campaigns, keywords, and ad copy drove traffic to each variant, and what those visitors actually converted into. Only then can you pick winners based on cost per acquired customer instead of vanity metrics that don’t impact your bottom line.
Why Most Landing Page A/B Tests Don’t Lower Your Acquisition Costs
Most A/B tests measure page engagement metrics instead of business outcomes, creating winners that actually increase your cost per lead.
The fundamental issue is the metrics gap. Traditional A/B testing platforms measure what happens on the page — click-through rates, time on page, scroll depth, form submissions. These are engagement signals, not business results. A variant can score higher on every engagement metric while delivering lower-quality leads that cost more to acquire.
Here’s the dynamic at work: a variant with a higher form-fill rate isn’t necessarily a better-performing variant. It might have hit its higher conversion rate by making the form easier to complete — shorter fields, fewer qualifying questions — which attracts more casual browsers who never intended to buy. Or the headline change that boosted conversions might be pulling in traffic from different keyword intent levels within the same Google Ads campaigns.
The engagement-metrics trap is the default state of most A/B testing setups because the tools themselves only measure what happens on the page. Connecting variant performance back to cost per acquired lead is a separate integration most teams never build.
Without connecting A/B test results back to ad spend and lead quality, you’re essentially flying blind. You might be optimizing your landing pages in a direction that makes your Google Ads campaigns less profitable, not more.
What You’re Actually Testing (and Why It Matters for Google Ads)
Landing page A/B tests should focus on elements that affect cost per lead, not just conversion rate — headline alignment, trust signals, and form friction create the biggest impact.
The hierarchy of what to test matters enormously. Not all landing page elements have equal impact on your Google Ads performance. Based on what consistently moves cost per lead across most Google Ads accounts, these elements drive the largest improvements:
Headline-to-ad alignment is consistently the highest-impact element to test. When your landing page headline doesn’t match the promise made in your Google Ad, visitors bounce immediately or convert at lower intent levels. Test headlines that mirror your highest-performing ad copy exactly versus generic value propositions.
Trust signal placement affects lead quality more than quantity. Elements like customer testimonials, industry certifications, and “since 2015” credibility markers help qualified prospects convert while deterring tire-kickers. This improves cost per lead by filtering traffic rather than increasing overall conversion rates.
Form length and field types create the biggest trade-off between conversion rate and lead quality. Shorter forms convert more visitors but often capture lower-intent leads. Longer forms with qualifying questions convert fewer people but at higher intent levels. The optimal balance depends on your Google Ads keyword strategy and lead qualification process.
Single versus multiple CTAs impacts both conversion rate and tracking clarity. Multiple CTAs can boost overall conversions but make it harder to track which specific offers drive the best cost per lead from different keyword groups.
Page load speed affects Quality Score in Google Ads, which directly impacts your cost per click before visitors even see your page content. A slow-loading landing page creates a double penalty: higher ad costs and lower conversion rates.
The mistake most teams make is testing low-impact elements like button color while ignoring headline alignment. Fixing a headline-to-ad mismatch typically delivers far larger CPL improvements than any single design tweak.
The Sample Size Trap Most A/B Tests Fall Into
Required sample size depends heavily on your baseline conversion rate and the size of the improvement you want to detect — and for most small campaigns, the numbers are bigger than people expect.
The math is non-negotiable. At a typical 3% baseline conversion rate, detecting a 10% relative lift at 95% confidence needs roughly 30,000-40,000 visitors per variant — and the requirement grows fast as the improvement you’re chasing shrinks or your baseline rate drops. Plug your own baseline into a sample-size calculator before committing; it’s almost always larger than it feels.
The practical consequence: a campaign generating a few hundred conversions a month can only reliably detect large swings, not the incremental gains testing usually targets.
This creates the sample size trap: businesses start A/B tests with insufficient traffic, see inconclusive results after 2 weeks, then make decisions based on noise rather than signal. Most small-budget A/B tests end with “winning” variants that are actually within the margin of error — the win is illusory.
The trap gets worse when you factor in conversion attribution delays. Google Ads conversion tracking often has 1-7 day attribution windows, meaning your test results lag behind your traffic data. A test that looks significant on day 14 might show no real difference when delayed conversions are properly attributed.
Practical thresholds for reliable testing:
- 100+ conversions/month: Can test major changes (headlines, form structure) every quarter
- 500+ conversions/month: Can test moderate changes (CTA copy, trust signals) monthly
- 1,000+ conversions/month: Can test incremental changes (button placement, color) bi-weekly
Below 100 conversions per month, focus on implementing proven best practices rather than testing variants. The opportunity cost of running inconclusive tests outweighs the potential optimization gains.
A/B Testing That Connects to Cost Per Lead (Not Just Click-Through)
Effective A/B testing connects each variant’s conversions back to the specific Google Ads campaigns, keywords, and ad copy that drove the traffic, enabling optimization for cost per lead rather than conversion rate.
This is where most A/B testing platforms fall short. They can tell you that Variant B generated 14% more form submissions than Variant A, but they can’t tell you that Variant B’s leads came from $67-per-click keywords while Variant A’s leads came from $23-per-click keywords. Without that attribution, you’re optimizing in the dark.
Launch10 is purpose-built AI for Google Ads — its A/B testing connects each conversion back to its traffic source automatically. When someone converts on Variant B, the system tracks not just the page variant but also the Google Ads campaign, ad group, keyword, and specific ad copy that brought them to the page. This creates a complete picture: Variant B didn’t just get more conversions — it got more conversions specifically from your highest-intent, most expensive keyword traffic.
Here’s what that attribution reveals in practice:
Keyword-level variant performance: Variant A might perform better for broad match keywords (lower intent, higher volume) while Variant B converts better for exact match keywords (higher intent, lower volume). Traditional A/B testing would pick one overall winner, but keyword-specific optimization lets you serve different variants based on traffic source intent.
Campaign-level cost efficiency: Your branded search campaign might show different variant winners than your competitive campaign. Branded traffic already knows your business, so trust signals matter less and form simplicity matters more. Competitive traffic needs more persuasion and credibility.
Quality Score feedback loops: Landing page experience affects Quality Score, which directly impacts your CPC. A/B testing that tracks back to Quality Score lets you optimize for lower ad costs, not just higher conversion rates.
The integrated approach often changes which variants win. A variant that wins on raw conversion rate frequently loses on cost per lead once you factor in the keyword traffic that drove its conversions. Picking winners without that attribution is picking blind.
Most businesses can’t implement this level of attribution because they’re using separate tools for ads and landing pages. Google Ads runs in one platform, landing pages live in another, and A/B testing happens in a third tool. The data connections between these systems are often broken or delayed, making true cost per lead optimization impossible.
When NOT to A/B Test (and What to Do Instead)
Below 100 conversions per month, implement proven best practices instead of testing — 80% of landing page improvement comes from following established conversion principles, not from testing variants.
A/B testing isn’t always the right approach. The sample size requirements often exceed the traffic volumes most local businesses generate, and running inconclusive tests wastes time — implementing “winning” variants that aren’t statistically significant can actually hurt performance.
The 80/20 rule for landing page optimization: most of your measurable improvement comes from implementing the first few best-practice changes, not from ongoing A/B testing of incremental variants.
Best practices to implement before testing:
Headline-to-ad alignment: Your landing page headline should mirror your highest-performing Google Ad headlines exactly. This is typically the single highest-impact change you can make on cost per lead, especially when the ad-to-page mismatch was severe to start.
Mobile page speed optimization: The majority of Google Ads traffic comes from mobile devices, and pages that load in under 3 seconds outperform slower pages substantially on conversion. Use Google PageSpeed Insights to identify and fix speed issues before testing other elements.
Single, clear call-to-action: Remove competing CTAs that split visitor attention. One prominent CTA typically outperforms multiple options on cost per lead because it concentrates conversion intent.
When to start A/B testing: Wait until you’re generating at least 100 conversions per month and have implemented the core best practices above. At that point, test headline variations first (highest impact), then form structure, then trust signal placement.
The goal isn’t to test everything — it’s to lower cost per lead efficiently. For most businesses running Google Ads, that means getting the fundamentals right first, then testing only the highest-impact elements once you have sufficient traffic for reliable results. If you’d rather skip the manual setup, Launch10 ships the page, ad, and tracking together.
Related reading
- Connecting your landing page and ads — the message-match concept that most tests should target first
- Google Ads Quality Score and landing page experience — how page performance feeds back into ad costs
- How Launch10 works — variant testing tied to ad spend as one connected build
Frequently asked questions
How long should a landing page A/B test run?
What's a meaningful conversion rate lift to chase?
Can you A/B test with low traffic campaigns?
How do you tie A/B test results to ad performance?
What should you A/B test first on landing pages?

Co-Founder & CEO, Launch10
Greg Hockenbrocht is the Co-Founder and CEO of Launch10. Before Launch10, he was on the executive leadership team at Fundera through its acquisition by NerdWallet, where he led Growth & New Ventures following the company's IPO. Through Illuminated Ventures and work with founders and business owners, he saw a need for Launch10 to help bring clarity, confidence, and ease to digital marketing.