
Google Ads Quality Score: How Landing Page Experience Controls Your Costs

Google Ads Quality Score is a 1-10 rating that directly determines how much you pay per click. A higher Quality Score typically lowers what you pay per click for the same auction position. Quality Score combines three roughly equal factors: ad relevance, expected click-through rate, and landing page experience. Most businesses focus entirely on optimizing their ads because that’s the only piece agencies and ad tools can control. But landing page experience is one of three roughly equal Quality Score factors, alongside ad relevance and expected click-through rate—and it’s where most accounts lose 2-3 points that could slash their advertising costs.
The landing page experience component measures page load speed, mobile-friendliness, content relevance to your ads, and user experience signals. Google evaluates these factors through Core Web Vitals, mobile-first crawling, and content matching algorithms. When your landing page loads slowly, doesn’t match your ad copy, or provides a poor mobile experience, Google penalizes your Quality Score—which directly increases what you pay for every click.
How Google Calculates the Score You See
Quality Score is Google’s prediction of how relevant and useful your ad and landing page are to users searching for your keywords. Google calculates this score using three primary components, each contributing roughly one-third of the total score.
Ad relevance measures how closely your ad copy matches the intent behind your target keywords. If you’re bidding on “emergency plumber” but your ad talks about “scheduled maintenance,” Google assigns a lower relevance score. Expected click-through rate predicts how likely users are to click your ad based on historical performance of similar ads and keywords. Google analyzes billions of ad interactions to estimate whether your ad will attract clicks. Landing page experience evaluates the quality and relevance of the page users reach after clicking your ad.
Google only shows you Quality Scores as whole numbers from 1-10, but internally uses decimal precision. A keyword might score 6.7, but you’ll only see “7” in your account. This rounding means small improvements might not immediately show up as score changes, even though they’re reducing your costs behind the scenes. Additionally, Quality Score is calculated at the keyword level, not the ad group or campaign level, which means different keywords in the same campaign can have vastly different scores.
The score updates dynamically based on recent performance data, typically using the last 30-90 days of activity. Newly created keywords start with no Quality Score and develop one after accumulating sufficient data—usually 100-200 impressions. Historical Quality Score data influences future calculations, so early optimization matters significantly for long-term cost efficiency.
The Landing Page Experience Trap
Landing page experience is one of three roughly equal Quality Score factors, yet most businesses ignore it completely when optimizing their Google Ads campaigns. This happens because agencies can rewrite ad copy but can’t rebuild landing pages, and traditional page builders create pages that exist separately from your ad campaigns.
Most “improve your Quality Score” advice focuses on keyword research, ad copy testing, and bid adjustments because those are the only levers available to agencies and ad management tools. They’ll tell you to increase your click-through rates or improve ad relevance, but they can’t fix the fundamental problem: your landing page loads slowly, doesn’t match your ad promises, or provides a poor mobile experience.
Launch10 recently experienced this firsthand when our mobile PageSpeed Insights score dropped to 72 after an update to our page. The root cause was Largest Contentful Paint (LCP) from hero text rendering, which we fixed through an overhaul to our page building infrastructure. PSI improvements of this magnitude typically translate to a “Landing page experience” bump from “Below average” to “Average” or higher in Google Ads — which can lower your cost per click.
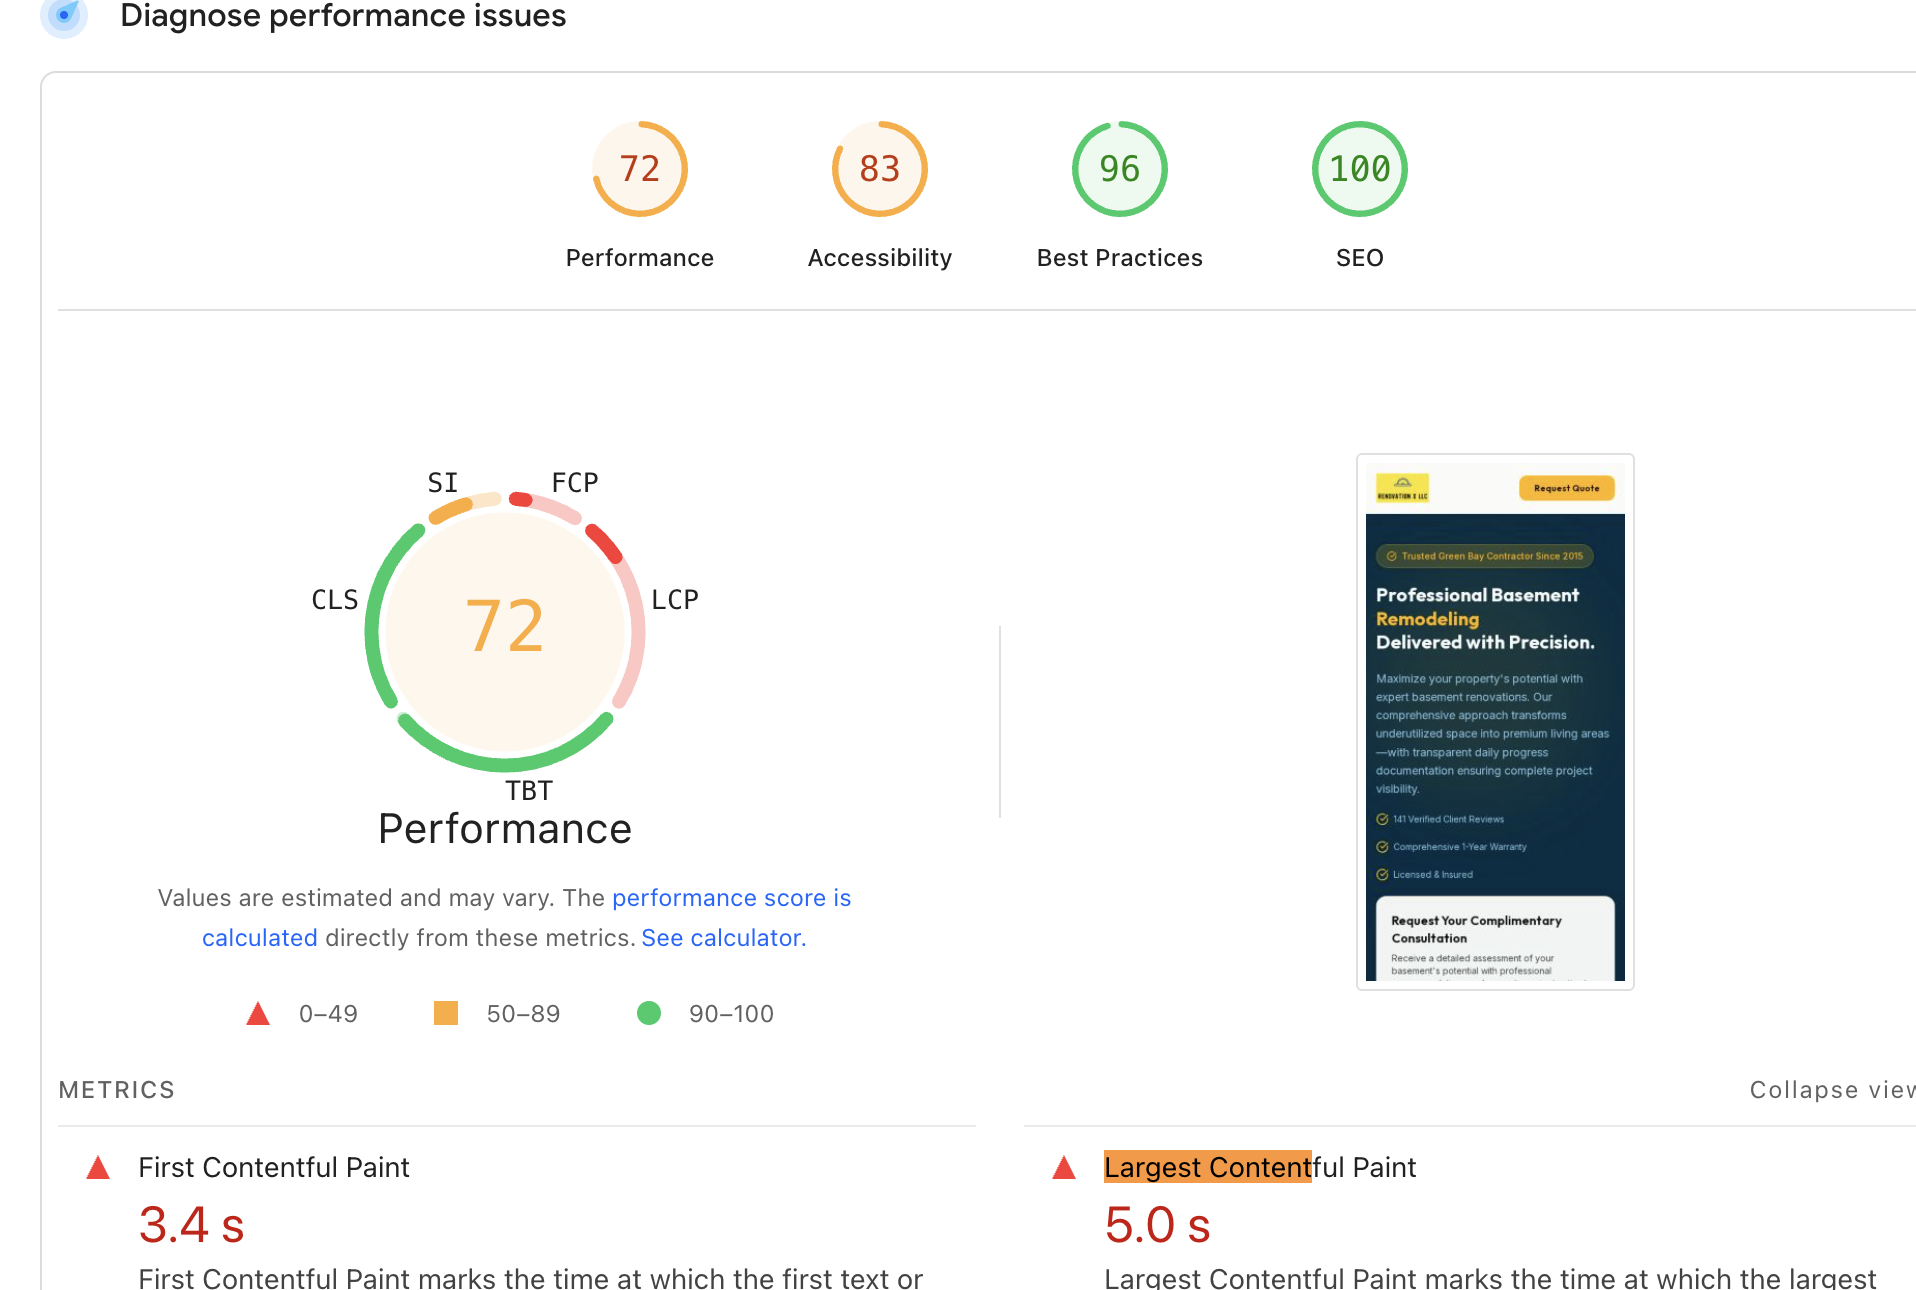
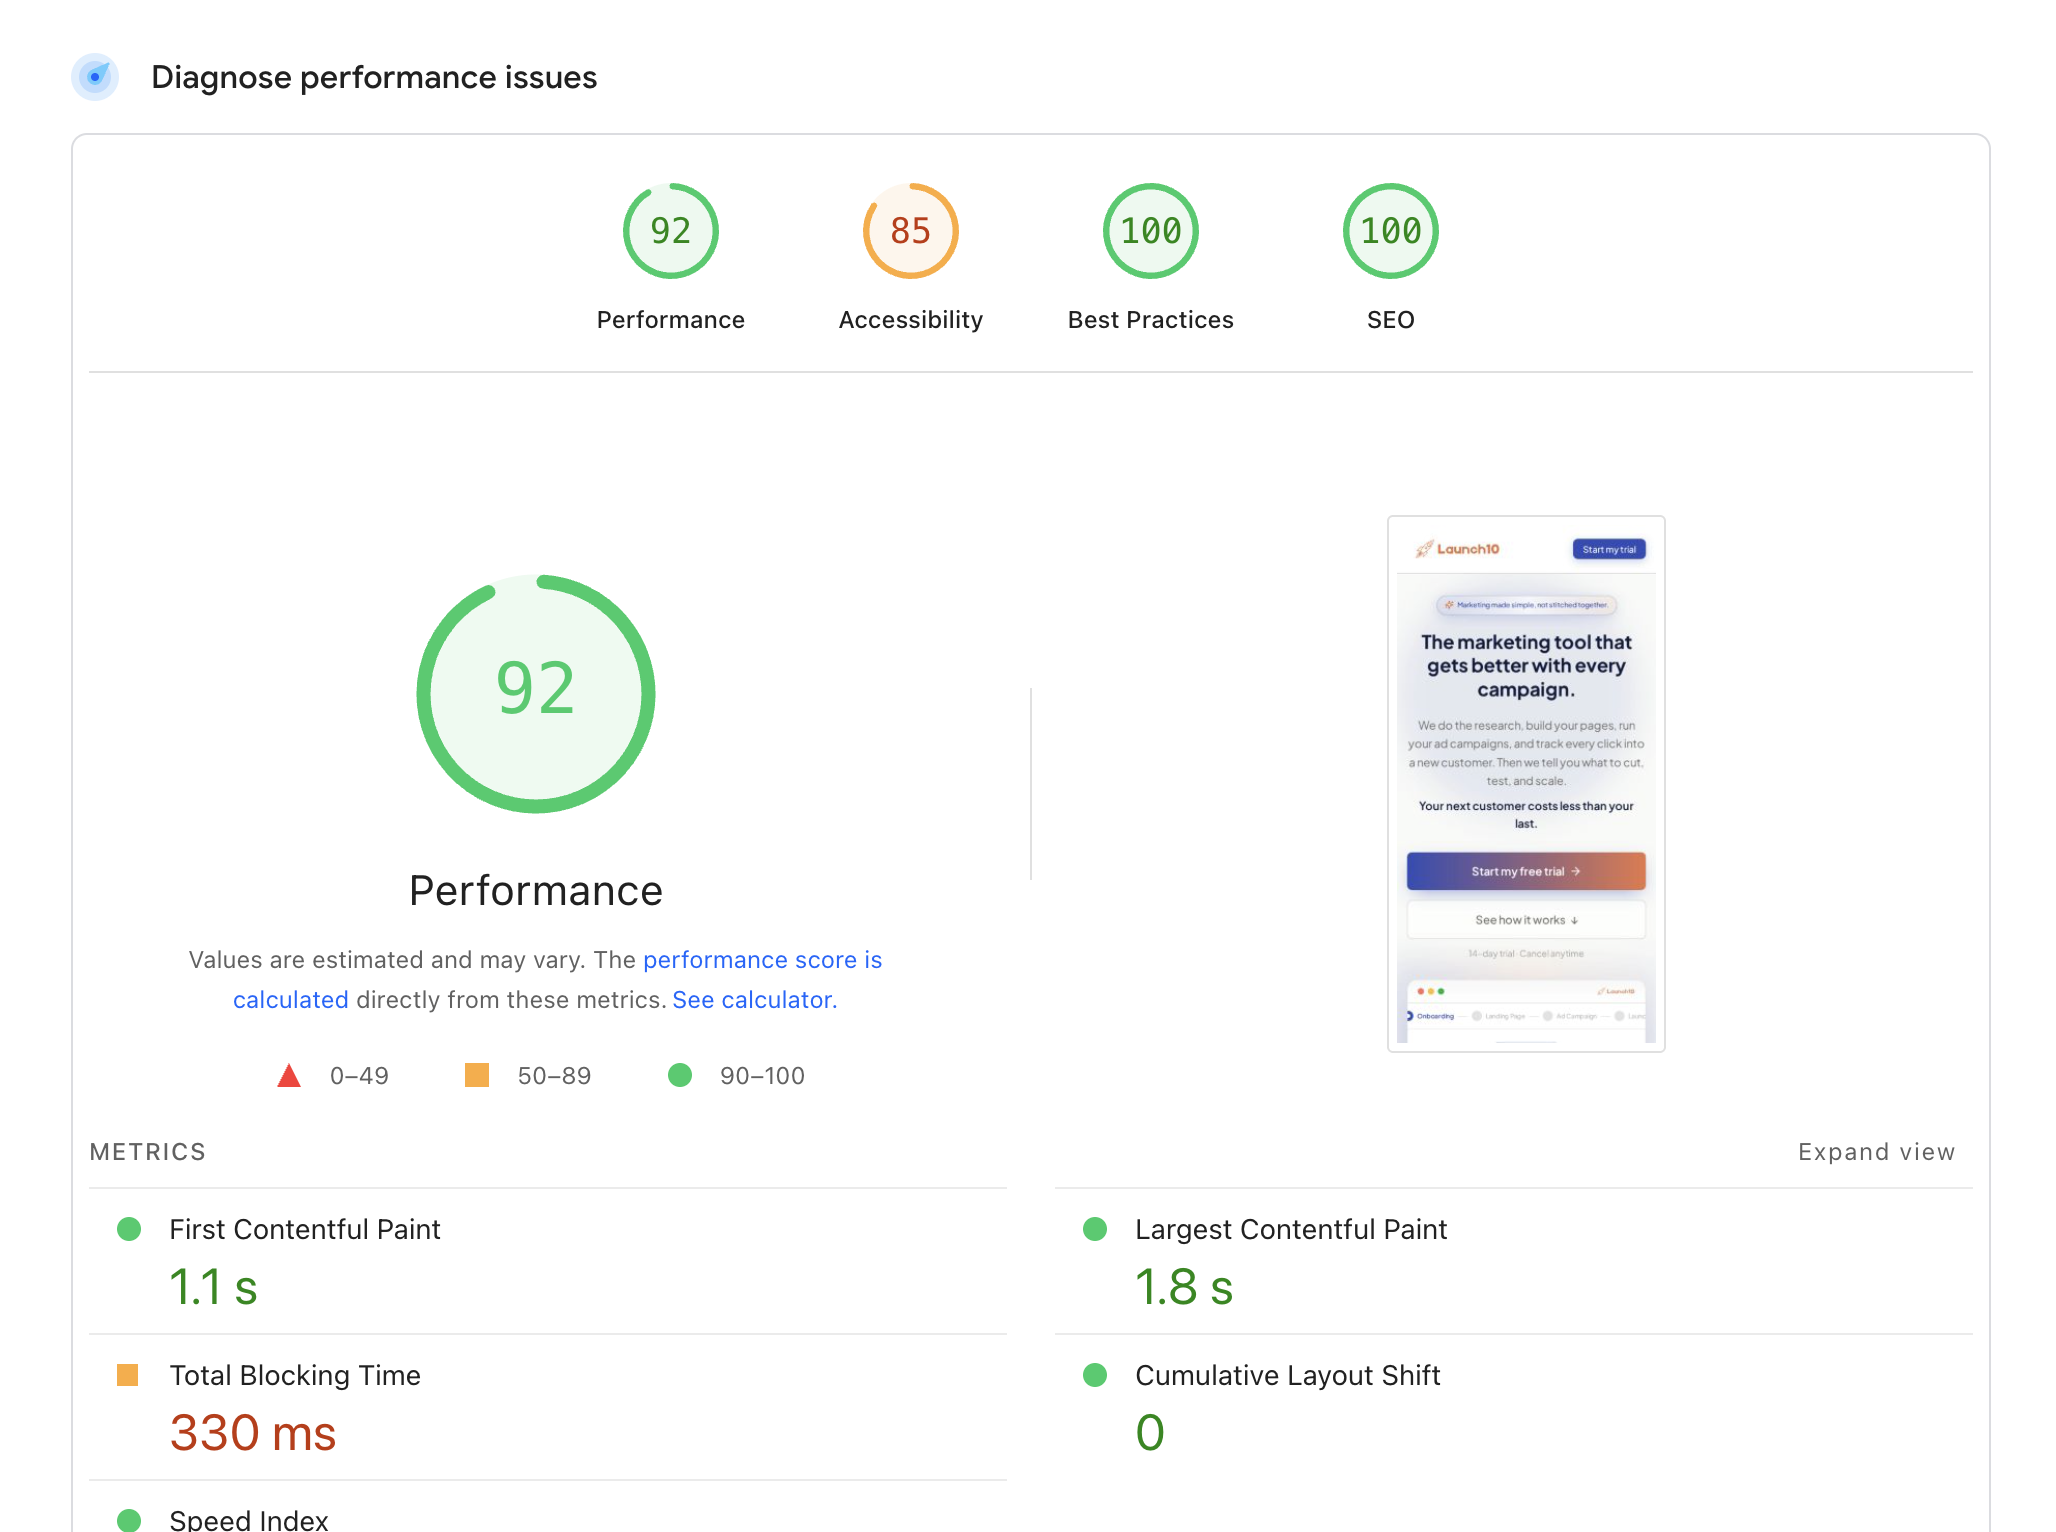
This coupling between page performance and ad costs is why generic page builders often hurt Google Ads performance rather than helping it. They optimize for visual design or conversion rates, not for the specific technical and content requirements that Google evaluates for Quality Score. The disconnect between page creation and ad management creates a blind spot where significant cost savings get lost.
How Page Speed Specifically Affects Quality Score
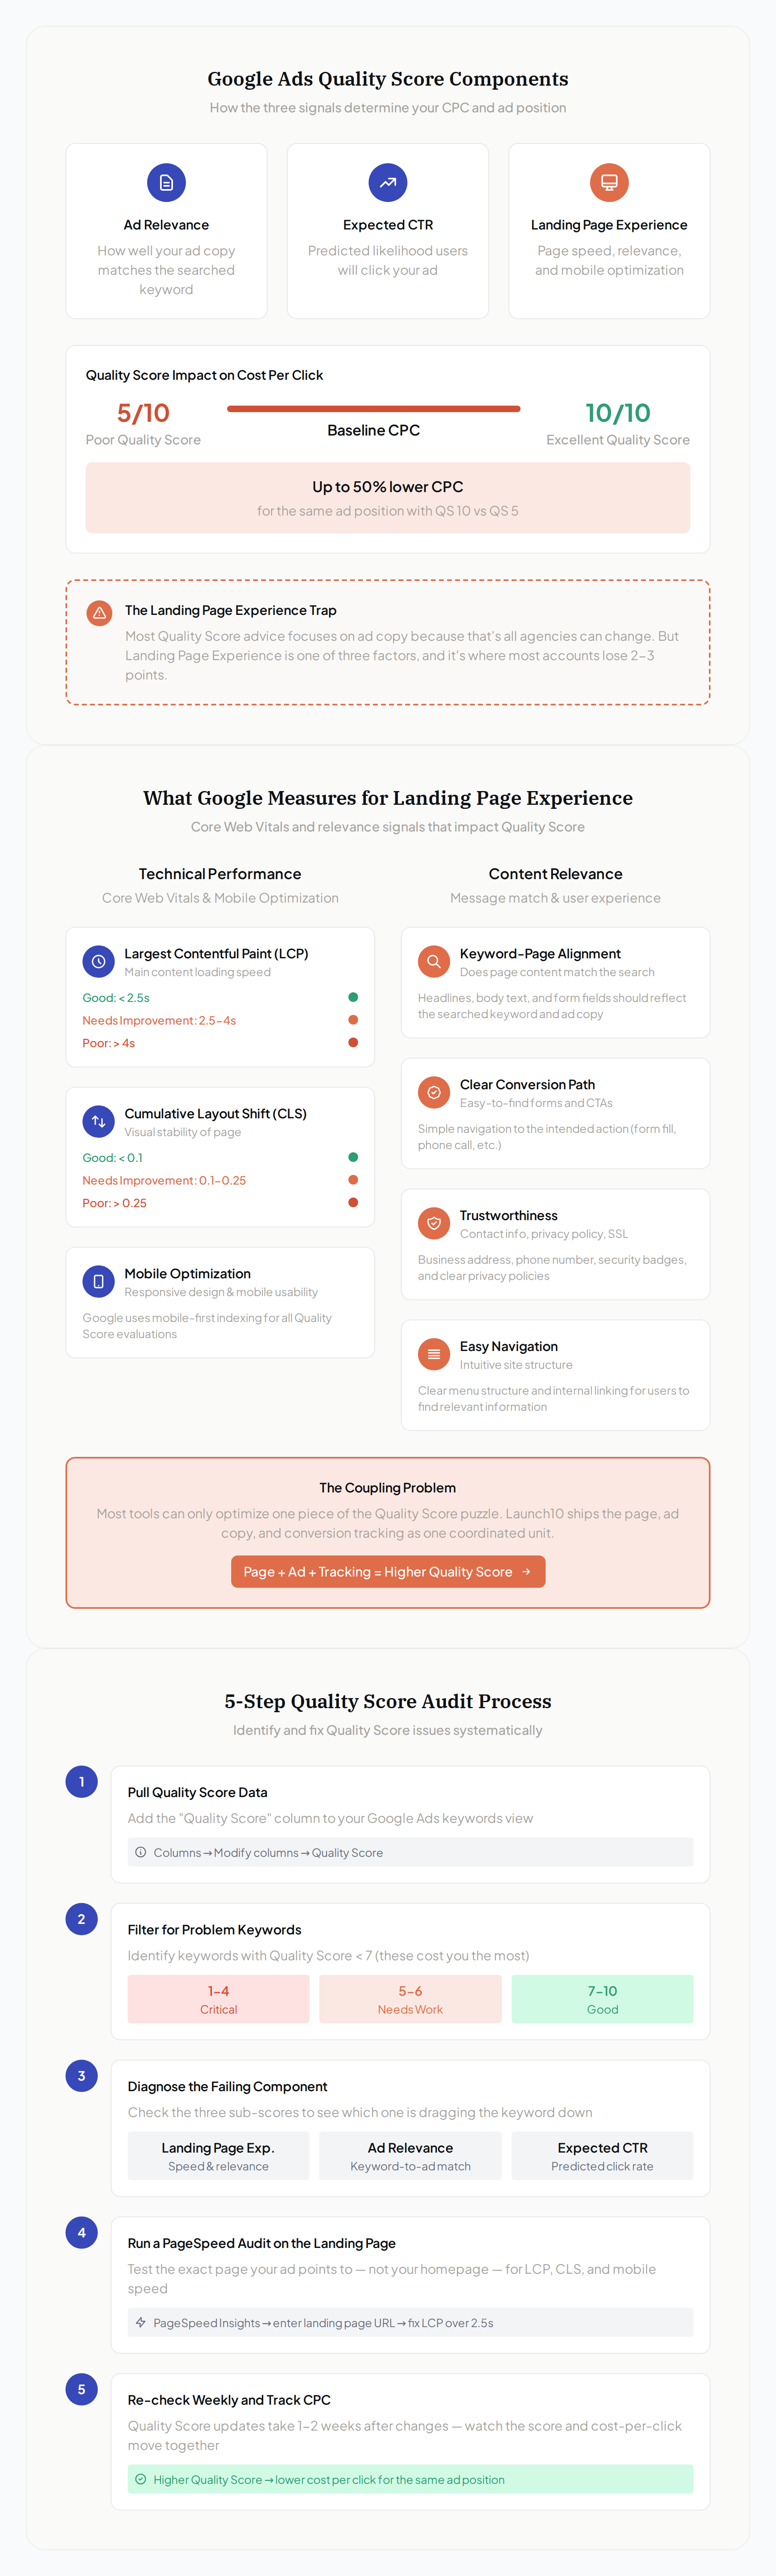
Page speed is the most measurable component of landing page experience and directly correlates with Quality Score improvements. Google uses Core Web Vitals as the technical foundation for evaluating landing page experience, with Largest Contentful Paint (LCP) being the most critical metric.
LCP measures how long it takes for the largest visible element to load on your page. Google considers anything over 2.5 seconds as “poor” performance, which typically correlates with “Below average” landing page experience ratings. Faster-loading pages tend to earn better landing page experience ratings, contributing to higher Quality Scores and lower costs.
Cumulative Layout Shift (CLS) measures visual stability during page loading. When elements move around as the page loads—like images pushing text down or forms jumping positions—Google interprets this as poor user experience. A CLS score above 0.1 typically results in lower landing page experience ratings. First Input Delay (FID) or Interaction to Next Paint (INP) measures responsiveness to user interactions like button clicks or form submissions.
Google’s mobile-first indexing means the mobile version of your landing page primarily determines your Quality Score, even for desktop traffic. If your page loads quickly on desktop but slowly on mobile devices, your Quality Score suffers across all devices. This is particularly important for service businesses where 60-70% of Google Ads traffic comes from mobile searches. Nonprofits on Google Ad Grants face the same test, and Google’s grant website policy tells them to check the mobile PageSpeed score specifically; see Google Ad Grants landing pages.
Beyond technical metrics, Google evaluates content relevance and user experience signals. If users immediately bounce back to search results after clicking your ad, Google interprets this as a mismatch between your ad promise and landing page content. High bounce rates and short session durations directly impact your landing page experience rating.
The Coupling Problem (and Why Most QS Advice Doesn’t Work)
The fundamental problem with Quality Score optimization is that it requires coordinating three different systems: your ads, your landing pages, and your tracking setup. Most businesses use separate tools for each, creating optimization blind spots that cost thousands of dollars in wasted ad spend.
Agencies can optimize your ad copy and keyword targeting, but they typically can’t modify your landing pages beyond superficial changes. When your ad promises “free estimates in 24 hours” but your landing page talks about “schedule a consultation,” Google detects this mismatch and lowers your Quality Score. The agency sees declining performance but can’t fix the root cause because they don’t control the page.
Traditional landing page builders focus on conversion optimization and visual design, not on Google Ads integration. They’ll give you beautiful pages with high conversion rates, but those pages might have slow load times, poor mobile experience, or content that doesn’t match your ad messaging. The page builder optimizes for different metrics than Google uses for Quality Score.
Launch10 is purpose-built AI for Google Ads that addresses this coupling problem by generating landing pages, ad copy, and conversion tracking as one coordinated workflow. When you describe your business and target keywords, the platform creates QS-tuned pages that specifically match your ad messaging, meet Google’s Core Web Vitals thresholds, and track conversions back to the specific ad and keyword that drove them. This coordination allows Quality Score improvements that compound week over week, rather than fighting against mismatched components.
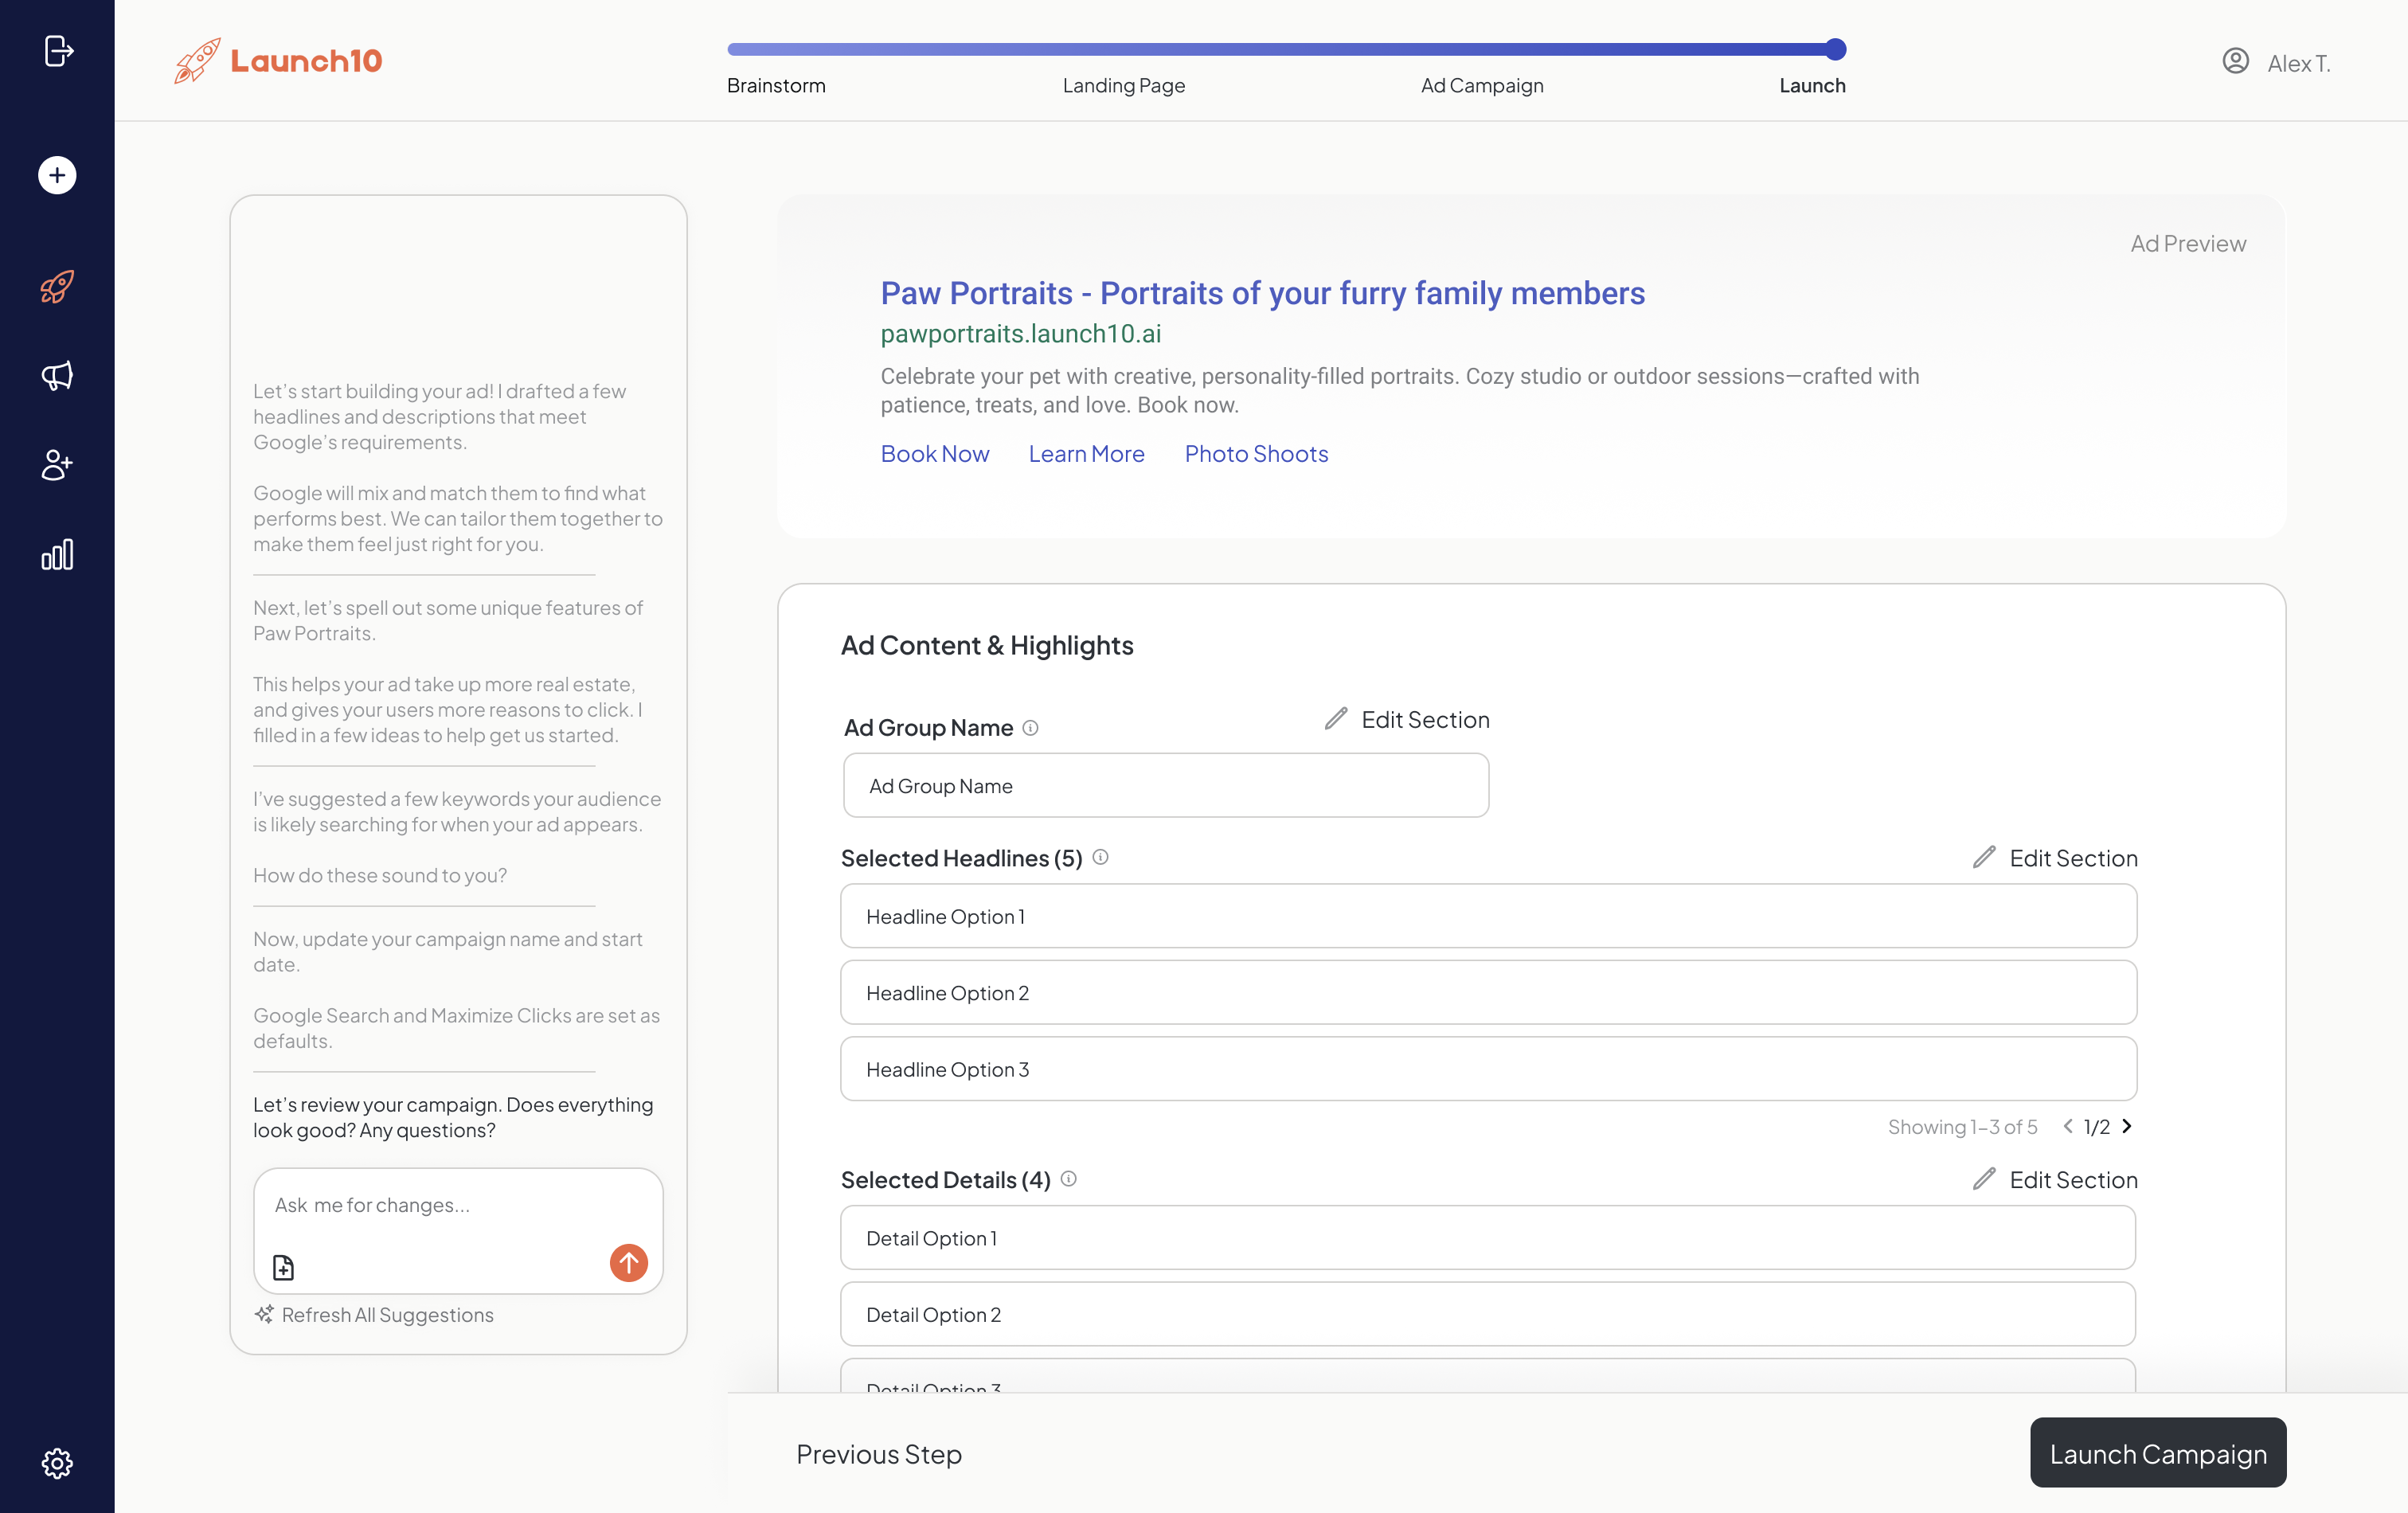
The coupling extends to conversion tracking as well. If Google can’t verify that your ads generate actual business results, it assumes lower conversion rates and adjusts Quality Score accordingly. When landing pages, ads, and tracking work together, Google sees clear signals that your ads provide value to users, which improves all Quality Score components simultaneously.
A Practical Quality Score Audit You Can Run Today
A practical Quality Score audit takes 30-45 minutes and focuses on three things: finding your worst-scoring keywords, diagnosing which component is broken, and matching the fix to the failing sub-score.
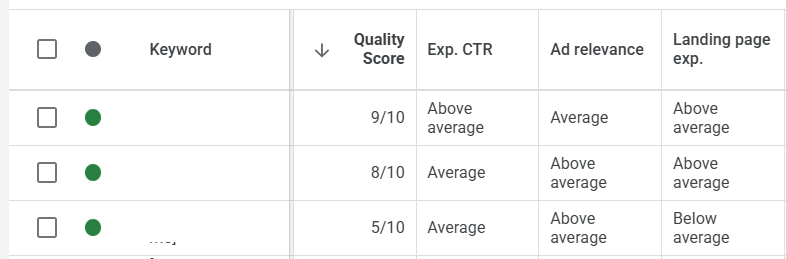
Start by accessing your Quality Score data in Google Ads. Navigate to your Keywords tab and add the Quality Score column if it’s not already visible. Also add the “Landing page exp.,” “Ad relevance,” and “Exp. CTR” columns to see component scores.
-
Identify low-performing keywords by filtering for Quality Scores below 7. These keywords are costing you 15-50% more than they should be. Export this list and prioritize keywords with high impression volume, as improvements here will have the biggest cost impact.
-
Diagnose the specific problem by examining the three component scores. If “Landing page exp.” shows “Below average,” focus on page speed and content relevance first. If “Ad relevance” is the issue, your keywords and ad copy need better alignment. If “Exp. CTR” is low, test different ad headlines and descriptions.
-
Run technical audits on your landing pages using Google PageSpeed Insights. Test the exact pages linked from your ads, not your homepage. Look for LCP over 2.5 seconds, CLS above 0.1, or mobile usability issues. These technical problems directly translate to lower Quality Scores.
-
Match content to ad promises by reviewing what each ad specifically claims, then ensuring your landing page delivers on that promise immediately. If your ad mentions “emergency service,” those words should appear prominently on your landing page. If you promise “free estimates,” the form should clearly offer that.
-
Monitor Score changes weekly rather than daily, as Quality Score updates can take 7-14 days after implementing changes. Track the relationship between Score improvements and cost-per-click reductions. Document what changes produced the biggest improvements for future optimization efforts.
For businesses running Google Ads across multiple service areas or offerings — whether that’s HVAC, dental, or other verticals — this audit process should be repeated for each major keyword theme. Quality Score optimization isn’t a one-time fix but an ongoing process that can meaningfully reduce your advertising costs when done systematically.
The most effective approach combines technical improvements with content optimization and tracking verification. When you fix page speed issues, align ad-to-page messaging, and ensure proper conversion tracking, Quality Score improvements compound across all three factors rather than addressing them in isolation. If you’d rather not assemble this stack yourself, Launch10’s pricing covers the page, the ad, and the tracking together.
Related reading
- Connecting your landing page and ads — the message-match foundation behind landing page experience
- Google Ads conversion tracking setup — the tracking signal that feeds Quality Score
- How Launch10 works — page, ads, and tracking generated as one coordinated build
Frequently asked questions
How is Google Ads Quality Score calculated?
Can I see my landing page experience score?
Does improving Quality Score actually lower my CPC?
How long after fixing my landing page does Quality Score improve?
Is Quality Score the same as Ad Rank?

Co-Founder & CEO, Launch10
Greg Hockenbrocht is the Co-Founder and CEO of Launch10. Before Launch10, he was on the executive leadership team at Fundera through its acquisition by NerdWallet, where he led Growth & New Ventures following the company's IPO. Through Illuminated Ventures and work with founders and business owners, he saw a need for Launch10 to help bring clarity, confidence, and ease to digital marketing.